Visualizations
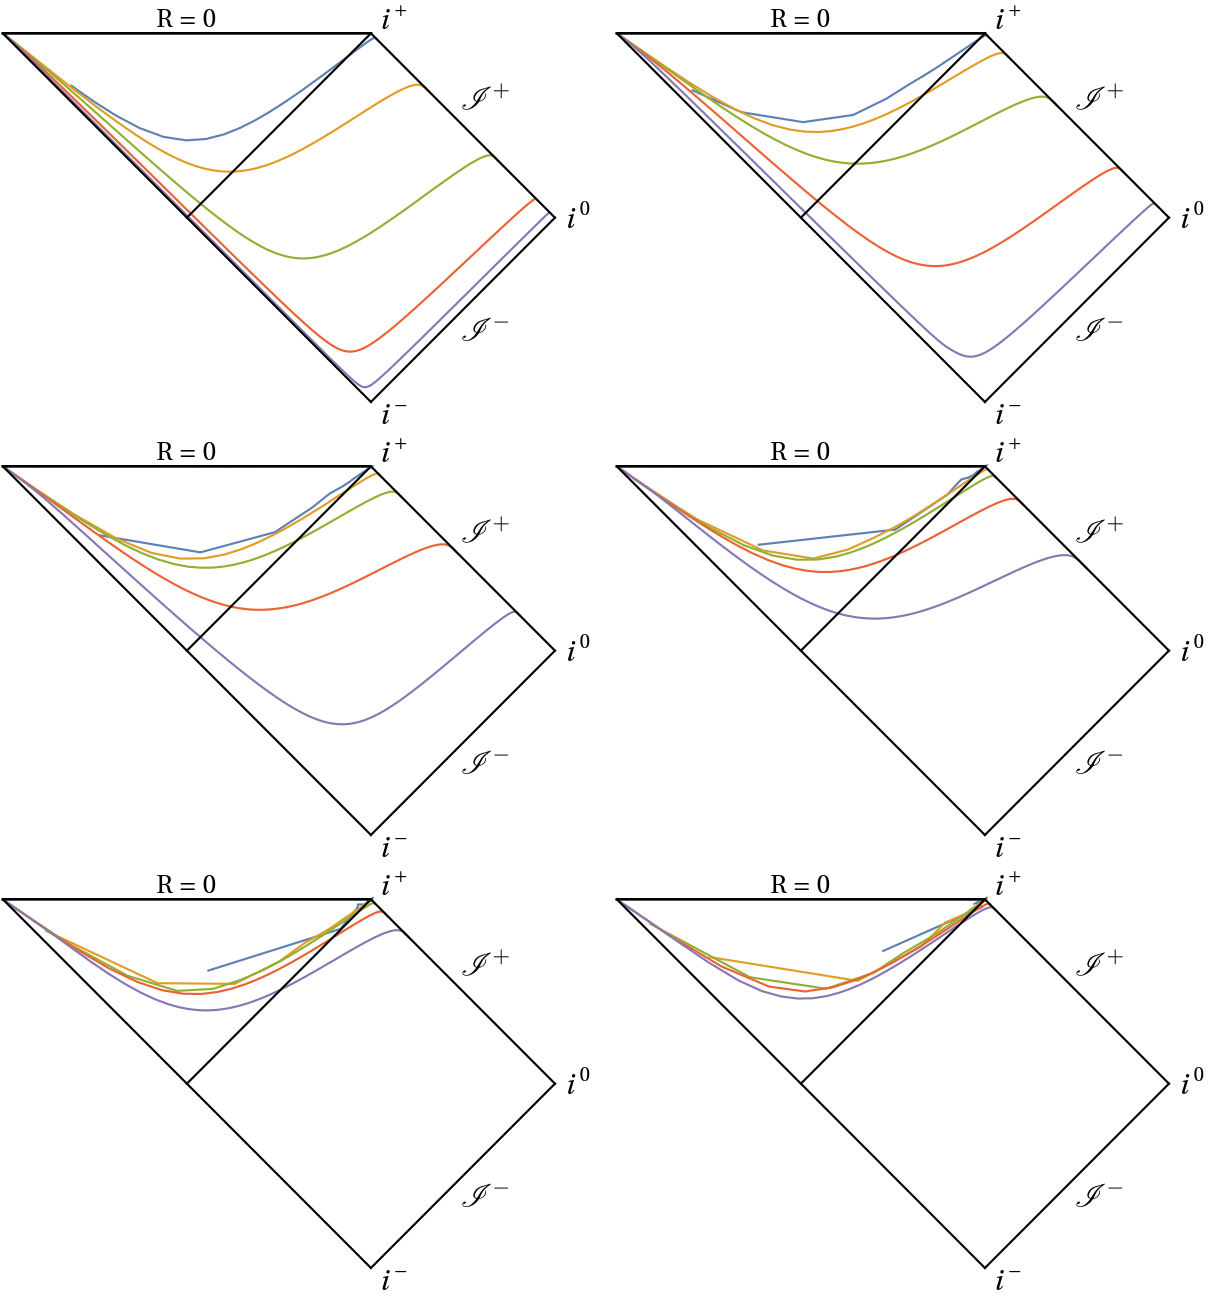
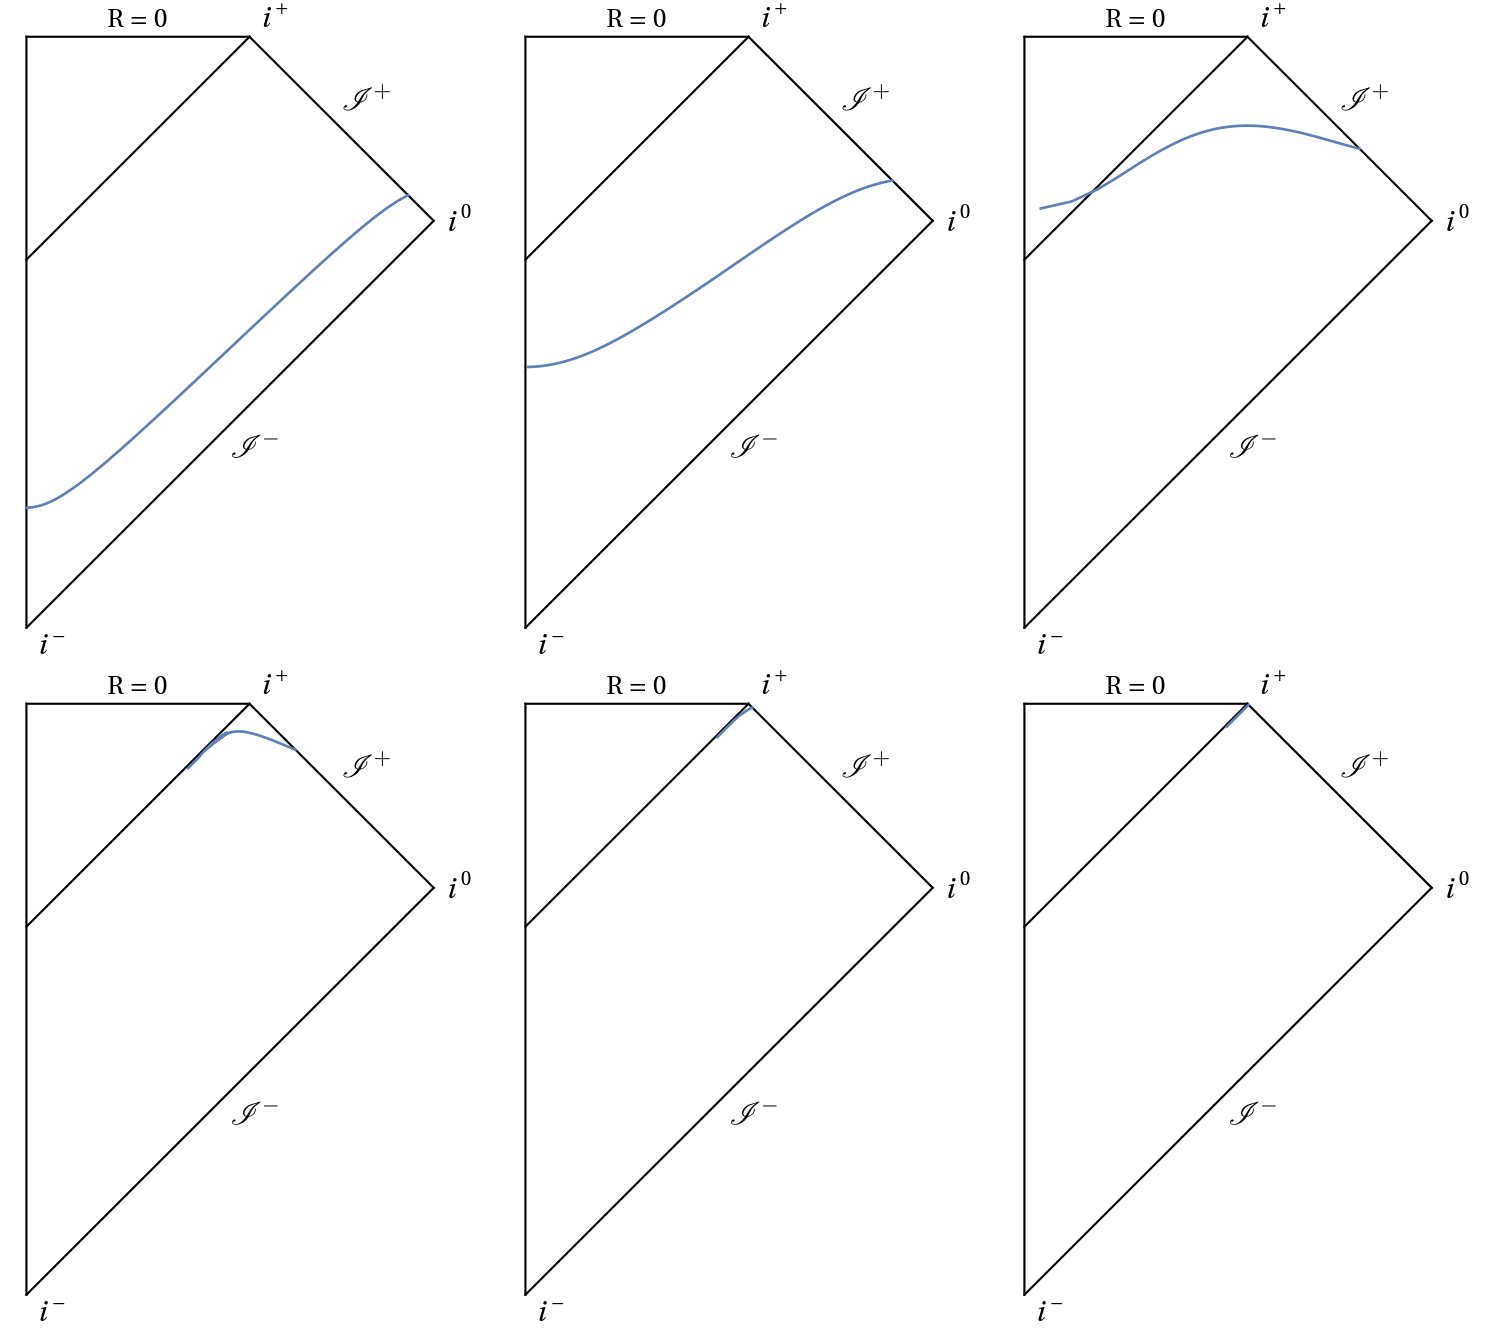
Penrose diagrams to see the numerical evolution of slices.
In this project I use conformal Carter-Penrose diagrams to understand the behaviour of hyperboloidal slices. Conformal diagrams allow to compactify an infinite spacetime into a finite domain, while maintaining the same causal structure. They can depict stationary spacetimes (see for instance here), and they can also be used to visualize the behaviour of slices during evolution, as in these examples:


Work on this project has been presented in CQG41:105003 (2311.04972 [gr-qc]), with supplementary material in this GitHub repository and this Mathematica Notebook Archive. A very interesting extension to electrically charged spacetimes (e.g. Reissner-Nordström black hole) will take place as soon as hyperboloidal evolutions of the Einstein + Maxwell equations become available. Stay tuned!
References
2024
-
Conformal diagrams for stationary and dynamical strong-field hyperboloidal slicesClass. Quant. Grav., Apr 2024